BY CORY MORRISON
Wild weather is affecting all corners of the globe. It’s interesting to look beyond the floods and flash freezes at what makes them happen. These are known as weather teleconnections.
According to NOAA, one primary driver in the weather pattern is the sea surface temperature anomalies in the Central Pacific Ocean. This phase is known as the El Nino Southern Oscillation (ENSO). When these waters are warmer than average, this is an El Nino phase. When these waters are colder than usual, this is a La Nina phase.
According to an NOAA video, El Nino typically brings milder, drier winters to Southern Canada and Northern U.S.; and wet winters to Southern U.S. An example of this is in the Super El Nino winter of 1997-98, Florida had significant rainfall.
La Nina usually brings cold, stormy winters to Southern Canada and Northern U.S. and warm, dry winters to Southern U.S. An example of this is in the strong La Nina year of 2011. Texas had its driest calendar year and hottest summer on record.
There are also teleconnections that apply to other parts of North America. One teleconnection is the Arctic Oscillation (AO). According to North

The North Atlantic Oscillation (NAO) indicates temperature anomalies in the North Atlantic Ocean near Iceland. When this region is colder than usual, there is less blocking resulting in warmer than normal temperatures for much of Southern Canada into the U.S. A western Atlantic ridge is also a feature. This phase is
The Pacific North American (PNA) shows temperature anomalies in Western North America. When this region is warmer than usual, this will frequently bring colder than average temperatures to Eastern North America. This phase is the positive PNA. The opposite scenario is the negative PNA.
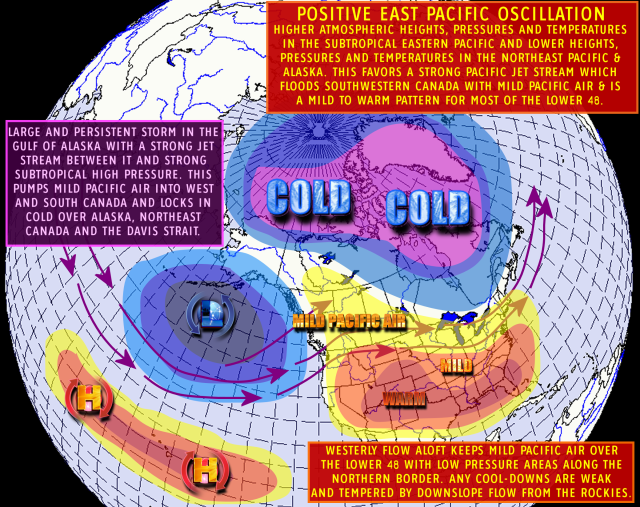
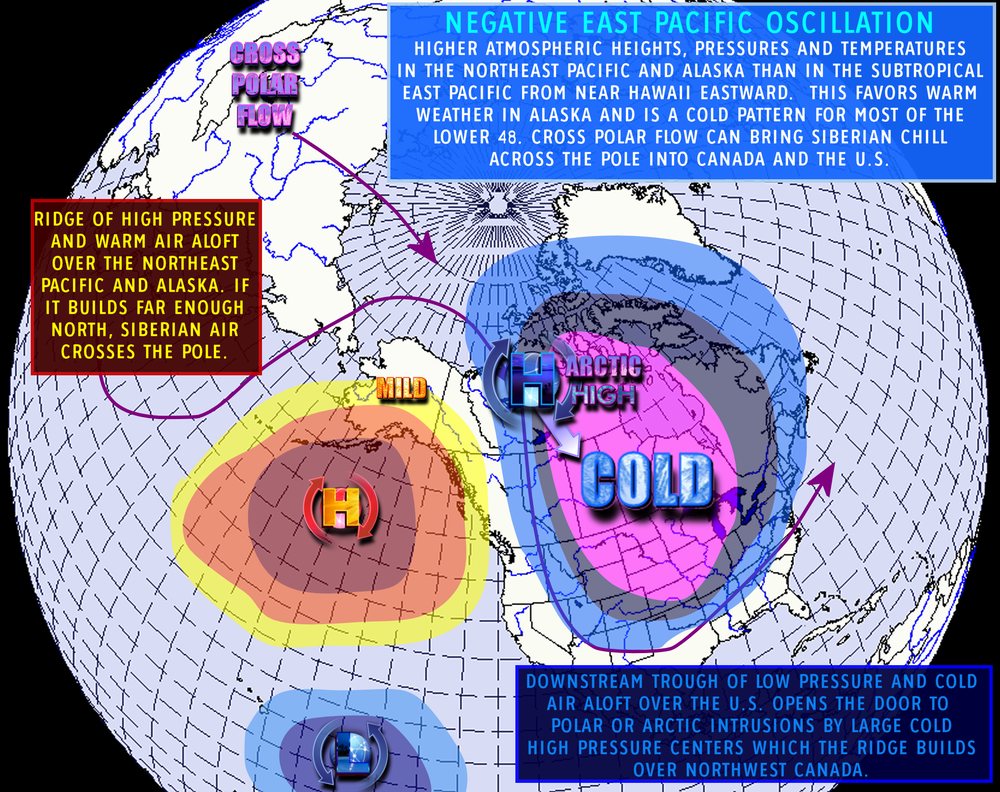
The Eastern Pacific Oscillation (EPO) indicates temperature anomalies in the Gulf of Alaska. When this region is colder than average, this causes the jet stream to stay north leaving most of Southern Canada and the U.S. warm. This phase is the positive EPO. The opposite situation is the negative EPO.
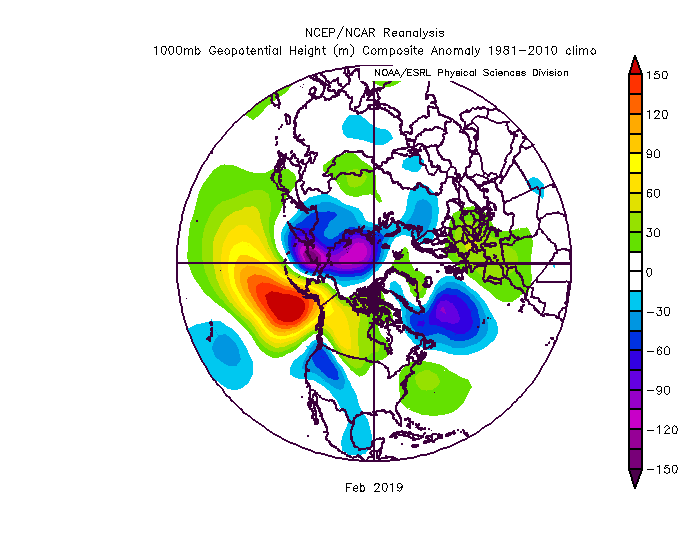
A common driver for a stormy pattern in Southern Ontario is to have a negative EPO and PNA combine, parking the coldest air in Western North America. The jet stream’s next step would be to create a west Atlantic ridge. When cold to our west meets with warmth to our east, this is a time to watch for potential storm warnings. This pattern was familiar this past February.
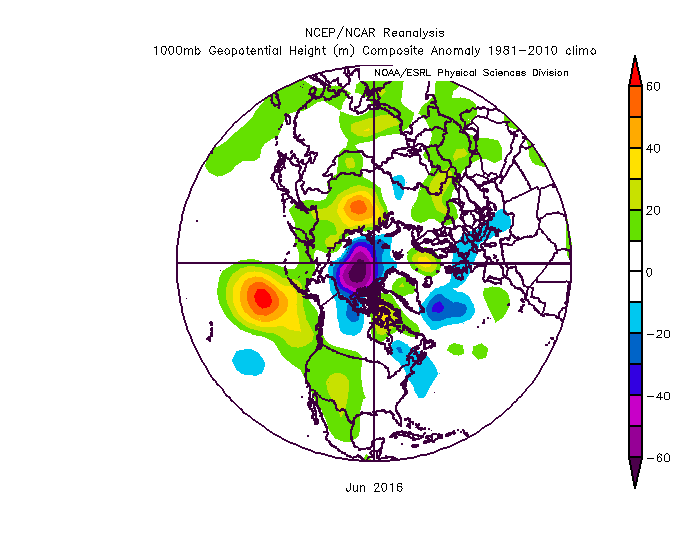
An example of a dry setup here is to have a positive PNA, AO, and NAO combine. This setup bottles the cold up north and allows a zonal flow in the jet stream. With a zonal flow, the pattern is often quieter here meaning fewer storms. This pattern was common in June 2016, which had the driest June since 1991 here.
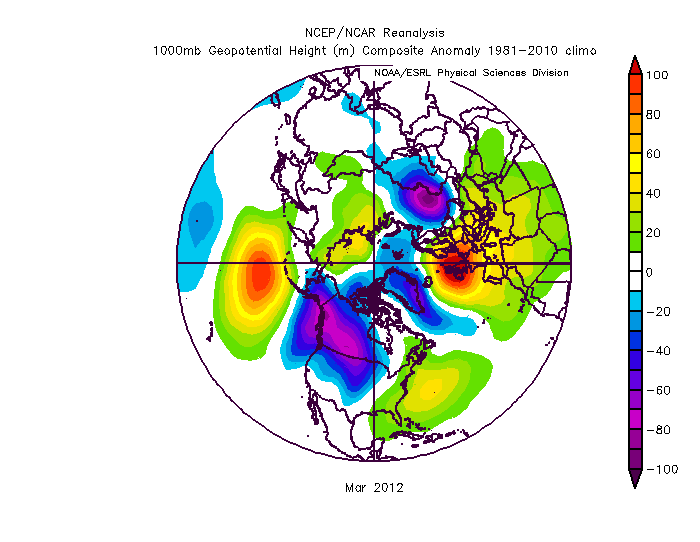
A frequent driver for a warm pattern here is to have a positive EPO and negative PNA connect, resulting in cold temperatures in the West. If a positive AO and NAO combine with this, meaning an anomalously cold North, warmth easily spreads in the East. This scenario is what happened in March 2012, which was our warmest March on record.
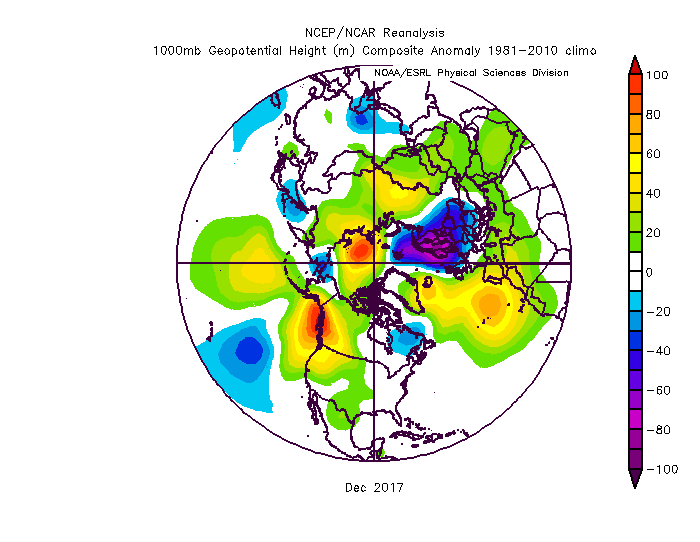
With colder weather, an example is to have a negative EPO and positive PNA combine to ensure an anomalously warm West, and a negative AO and NAO combine to provide an anomalously warm North. Since the anomalous cold has to go somewhere, this results in a dip in the jet stream parking a trough in the East. This pattern was frequent in December 2017. Waterloo, for instance, had its coldest December in 17 years.